Population Pyramids
Turlock's population is stable to declining slowly. I think this is happening because people may move out of the area for better job opportunities. This is also an area that people raise families in, so that can contribute to the stabilization of the population
New York City's population is declining. This could be because parents do not want to raise their children in a city environment, so they move out of the city into the suburbs.
Chicago's population is declining. This is most likely due to parents not wanting to raise families in the city, and moving to the suburbs.
Seattle's population is rapidly declining based on this population pyramid. This could be because Seattle has many colleges, so there is a large population of older adults. The large amount of adults outnumber the amount of small children in the city.
San Francisco's population is declining. This could be because San Francisco is a business based city and there are many adults living there. Also, parents would choose to live farther away from the city while raising their children.
Boston's population is declining. This could be because Boston has many colleges and a large amount of young adults move there for school. Also, after they finish school many people must leave because the numbers decline after 24 years old.
Austin's population is declining. There is a large amount of young adults, this could be due to the college in the city. However, there is a quite a large amount of under 5 year olds that could eventually start the slow expansion of the city.
CLimate.gov Data observations
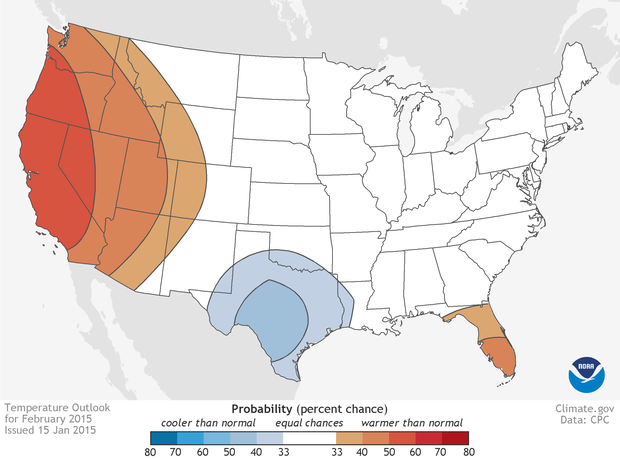
This is the temperature outlook for February 2015. There are parts of the country mostly in the west that were predicted to have warmer than normal temperatures. Florida was also predicted to have warmer than normal temperatures. However, Texas was predicted to have colder than normal temperatures.
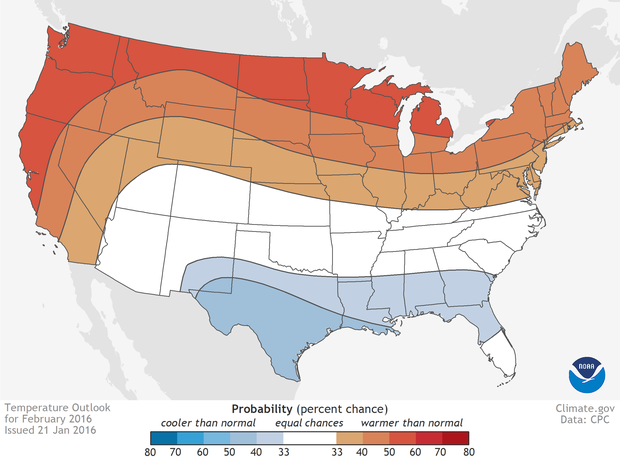
This is the temperature outlook for February 2016. The west and upper part of the United States were all predicted to have warmer temperatures than normal. Some parts such as northern California had an 80% percent chance that the temperature would be warmer than normal. The southeast portion of the country were all predicted with a 50% chance to have colder than normal temperatures.
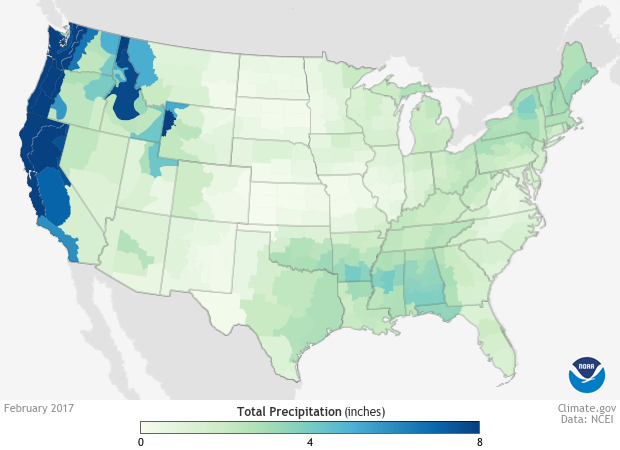
This is the total precipitation for the country in February 2017. California, Washington, Oregon, and Idaho got most of the rain for February. For example, some parts of northern California got up to 8 inches of rain. The east coast had some rain, but most places only averaged 3-4 inches.
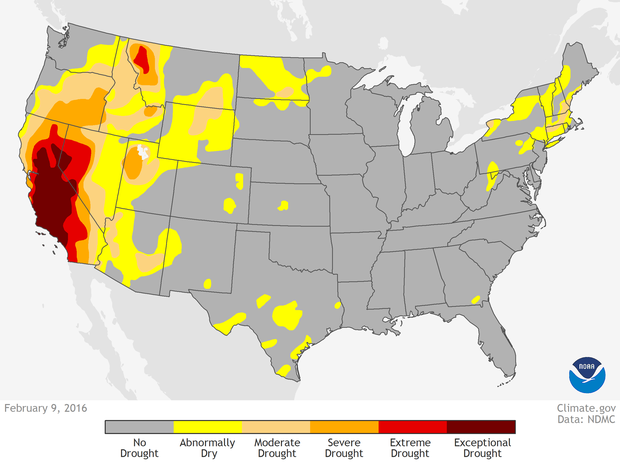
This is the drought monitor for February 9, 2016. This was an abnormal season for the west coast. Most parts were abnormally or moderately dry. However, some parts of California specifically the Central Valley and Southern California were in an exceptional drought. There was very little drought in the eastern part of the United States. The upper states near New York were abnormally dry.
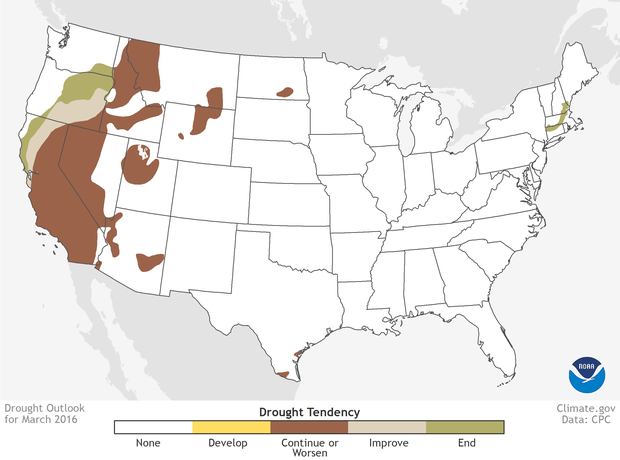
This was the drought outlook for March 2016. The drought was supposed to continue and worsen mostly in California. However, some parts of Oregon, Washington, Idaho, and Nevada were affected. In parts of Northern California, Oregon, and Washington the drought was supposed to end. The East coast was seemingly not affected by drought in March of 2016.
Species Diversity Lab |
|
|
1. Identify the parking lot that was the most diverse. Based on your observations during the lab, explain why your
prediction in question #1 of the prelab was supported or not supported.
- The student parking lot was the most diverse. My prediction was supported because the more brands of cars there were, the more diverse the parking lot was.
2. List the single most abundant species in each set of data, and write a plausible explanation to explain why these are
the most abundant species.
- The most abundant brand in the student parking was Chevy. This could be the most abundant species because a lot of people drive trucks and Chevy is a popular truck brand. The most abundant brand in the staff parking lot was Ford. This could be because ford makes smaller SUV's and cars that staff members like to use because they may have families.
3. Determine the maximum and minimum values for the Shannon Diversity Index in the parking lot you surveyed.
- The maximum value of the student parking lot was 2.41477006. The minimum value of the staff parking lot 2.372432838.
4. If you conducted this lab in a shopping mall parking lot, predict whether the Shannon Diversity Index would be high or
low, and how it would compare to the school parking lots.
- If this lab was conducted in a shopping mall parking lot, I believe that the Shannon Diversity Index would be high. It m would also be higher than the school parking lots because there were would be more cars than in the school parking lots.
5. If you conducted this lab at a new car dealership, predict whether the Shannon Diversity Index would be high or low,
and how it would compare to the school parking lots.
- If I conducted this lab at a new car dealership the Shannon Diversity Index would be low because the cars would all be the same brands.
Wooly Worm Lab
a. What were the degrees of freedom used in this excercise?
-The degree of freedom used in this exercise was 6.
c. What is the calculated chi-square (X2) value
-The calculated chi-square value was 79.23
d. What do your results indicate that it was chance alone that caused the unequal numbers of capture wooly worm pheneotypes? - The results indicate that if was not just chance that caused the unequal capture of the wooly worms phenotypes. The chi-
square value falls under the significant category, which means the unequal capture was purposeful.
e. Which colors of worms were subjected to a positive selection pressure? Which colors of worms were subjected to a negative selection pressure? Explain.
- Boogie, Olive Garden,rainbow dash, and bloodworm were the worms that were subjected to a positive selection pressure. These worms were more dully colored and could have been hard to see in grass. The worms that were subjected to a negative selection pressure were Firelash, Relish, and Pitman. These worms were more brightly colored and stood out more in the environment they were placed in.
f. What do these results indicate might happen over time to this wooly worm population?
- These results indicate that the populations of firelash, relish, and pitman would decrease more rapidly than the other populations of worms.
g. Consider feeding times, feeding habits, ability to see color, vision acuity, and other possible characteristics, of predatory birds in nature. How might such characteristics determine selection of certain worm colors?
- Brighter colors would be more visible to birds of prey in the wild and the worms would have less camouflage in the trees and plants. Worms with feeding times at night would be more likely to survive because it is harder to predators to see.
h. Consider the school grounds upon which you "fed" on your wooly worms. If this particular environment remained unchanged over a very long period of time, how would the populations change? What would the community look like in ten years?
- The populations of Boogie, Olive Garden, and Rainbow dash would continue to grow because they are the worms least targeted. The worms with brighter colors would be less prominent in the population. In ten years most of the worms would be boogie, olive garden, rainbow dash, bloodworm, and firelash. With pitman and relish having a small population.
